

LCMS District Comparison - Interactive
September 2025 Update for LCMS District Info

Earlier this year I published some data on the 35 districts in the Lutheran Church — Missouri Synod (LCMS). I used the best data I could at the time, but I was missing a number of districts.
Here is the updated LCMS Comparison info. This was gathered after all the Districts had their Conventions which made the data more readily available and up to date. Some data is still old.
More exciting than that, I was able to make an interactive map, which is much more user-friendly. I cannot embed it directly, but the interactive map is available here:
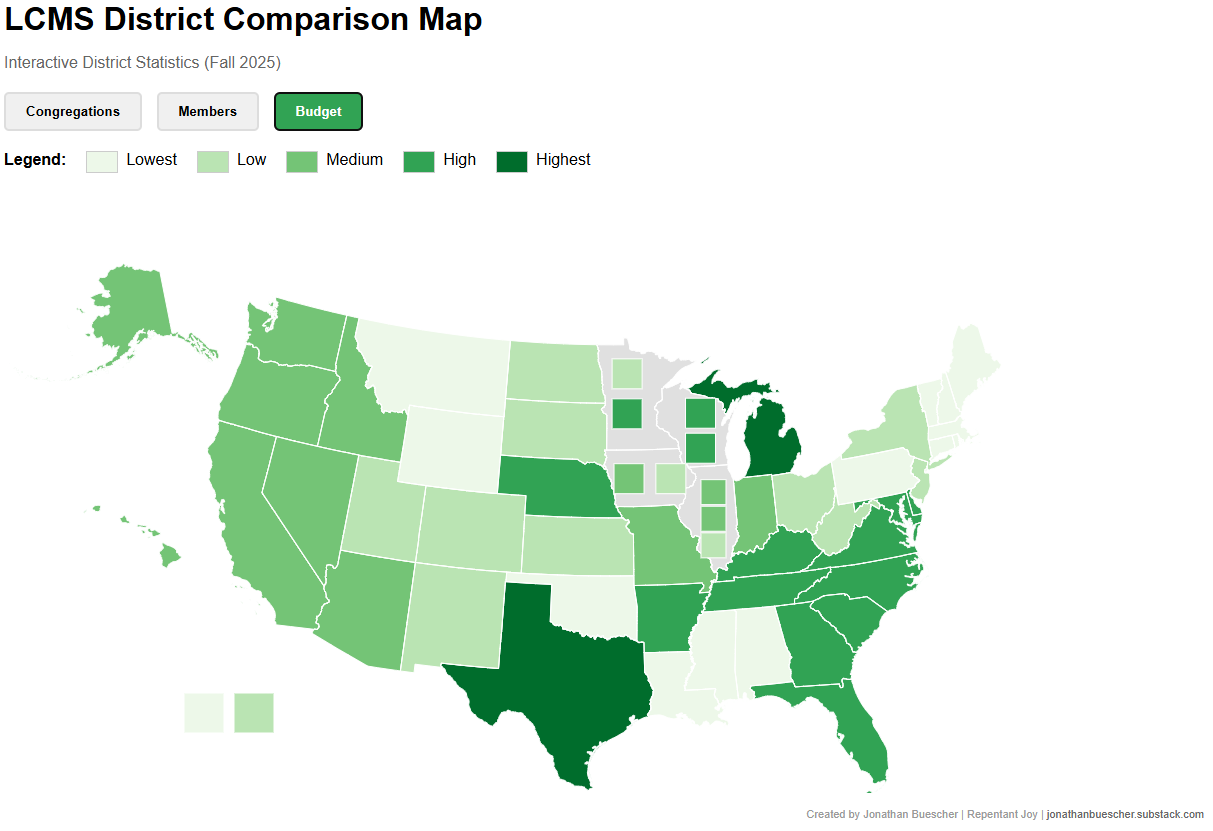
Not all of the data is included in the visualization, but the three major datapoints are: number of congregations, baptized membership, and district annual budget. You can find out more about the map’s creation in the footnote1.
Here are still images of the visualized data, at least for reference.


I was recently able to be a guest on the Lead Time podcast hosted by Tim Ahlman and Jack Kalleberg to talk a bit about the data. It was good be on with them! You can watch that episode here:
And finally, here is the spreadsheet for the updated info: (Click here for a full page version of the data)
And here is the extra spreadsheet I made just to see what it would look like if Wisconsin, Iowa, Illinois, and Minnesota were just 1 district each. (Click here for the full page version.)
Let me know if you find any errors in the data, and let me know if you thought the data was helpful in map form!
If you’re a little bit nerdy and want to know how I made the LCMS Interactive map, I did some “vibe coding” (AI assisted coding) on Claude to get the results. Obviously the map is not perfect. I used available map data for US states, but our districts are not divided cleanly that way. You’ll notice parts of states are in other districts, and I was not able to achieve that result. Hopefully the map is close enough to our districts to be helpful. Likewise you cannot easily cut states in half without getting into county data, or manually drawing the map lines. I didn’t have the time or skill for that. So I made the “boxes” in the states with multiple districts and the non-geographic districts.
You are more than welcome to use the map in your own projects if you desire. That code is available here!
Data points that interest me: 1) Numbers of and percentage of district congregations with multi-point parishes (2-?). The Atlantic District hosted the Wyoming district back in 2012 and 2/3 of the Wyoming congregations were multi-point. That would be good to know and to trend.
2) Congregations with under 40 in worship - number and trend. These don't necessarily need a building, could meet in the living room, or in many cases around the kitchen table.
3) Pastors over 65 (or 70) serving congregations by district and as a percentage of work force.
In this time of diminishment, more flexibility in pastoral formation and in congregational closure/merger/collaboration is needed - 250000 churches across the country may close in 2026. If there were or is a plan for mission that encouraged closure while mandating fresh and new starts with pastors and leaders whose heart is for Gospel outreach, good things would happen and could be funded with monies received from sale of property in closed congregations and ministries. It feels to me that we're doubling down on narrowing approaches to formation while keeping dead and dying congregations afloat for no earthly reason.
Dave Benke
This is a really great data. Great work. I think you have to consider average weekly worship attendance as well. Membership numbers alone give a distorted picture—they’re almost always inflated, in my experience. Weekly attendance is the real bellwether of congregational health and actual engagement.
I’m convinced most LCMS congregations are operating with at least a 30% inflation in their membership rolls, whether due to non-attending members, families who’ve moved, or people who haven’t been active in years but remain on the books. And when you compare the attendance numbers that are reported, you’ll see that the average congregation is worshiping at around 40% of its official membership, many times even less.
Until we get honest about attendance versus membership—and clean up our rolls accordingly—any analysis built on membership statistics alone is going to be misleading. Attendance tells the real story.